Body Fat Comparison: What Different Percentages Actually Look Like
You’ve seen the body fat percentage charts and found them confusing because the numbers alone don’t tell you much. A body fat comparison across real ranges, tied to visible reference points, gives you something concrete to work with. Whether you’re assessing where you are now or setting a goal, understanding the visual markers at each level helps you set expectations and track progress beyond what the scale shows.
The problem with most body fat percentage visual resources is that they show idealized or extreme examples. Real people at 20% body fat look different based on muscle mass, height, frame size, and where they store fat. That said, there are consistent patterns that make a body fat picture chart useful as a general guide. A body fat visual chart covers male and female reference ranges separately because the categories themselves differ. Body fat percentage chart pictures from clinical sources tend to be more accurate than gym-produced ones.
Body Fat Categories for Women
The American Council on Exercise defines these ranges for women:
- Essential fat: 10 to 13%. This is the minimum required for hormonal function and organ protection. Women at this level typically lack their menstrual cycle and experience fatigue and coldness. It’s not a goal range for general health.
- Athletes: 14 to 20%. Competitive female athletes, particularly runners, cyclists, and gymnasts, often sit here. Muscle definition is clear, particularly in arms, shoulders, and abdomen.
- Fitness: 21 to 24%. This range looks lean without being extreme. Abdominal muscles may be faintly visible. Most women who train regularly and eat well land here.
- Acceptable: 25 to 31%. The average American woman falls in this range. Muscle definition is minimal, and there is visible softness around the abdomen, hips, and thighs.
- Obese: 32% and above. Significant fat stores around the abdomen, back, and limbs. Health risk increases substantially above 35%.
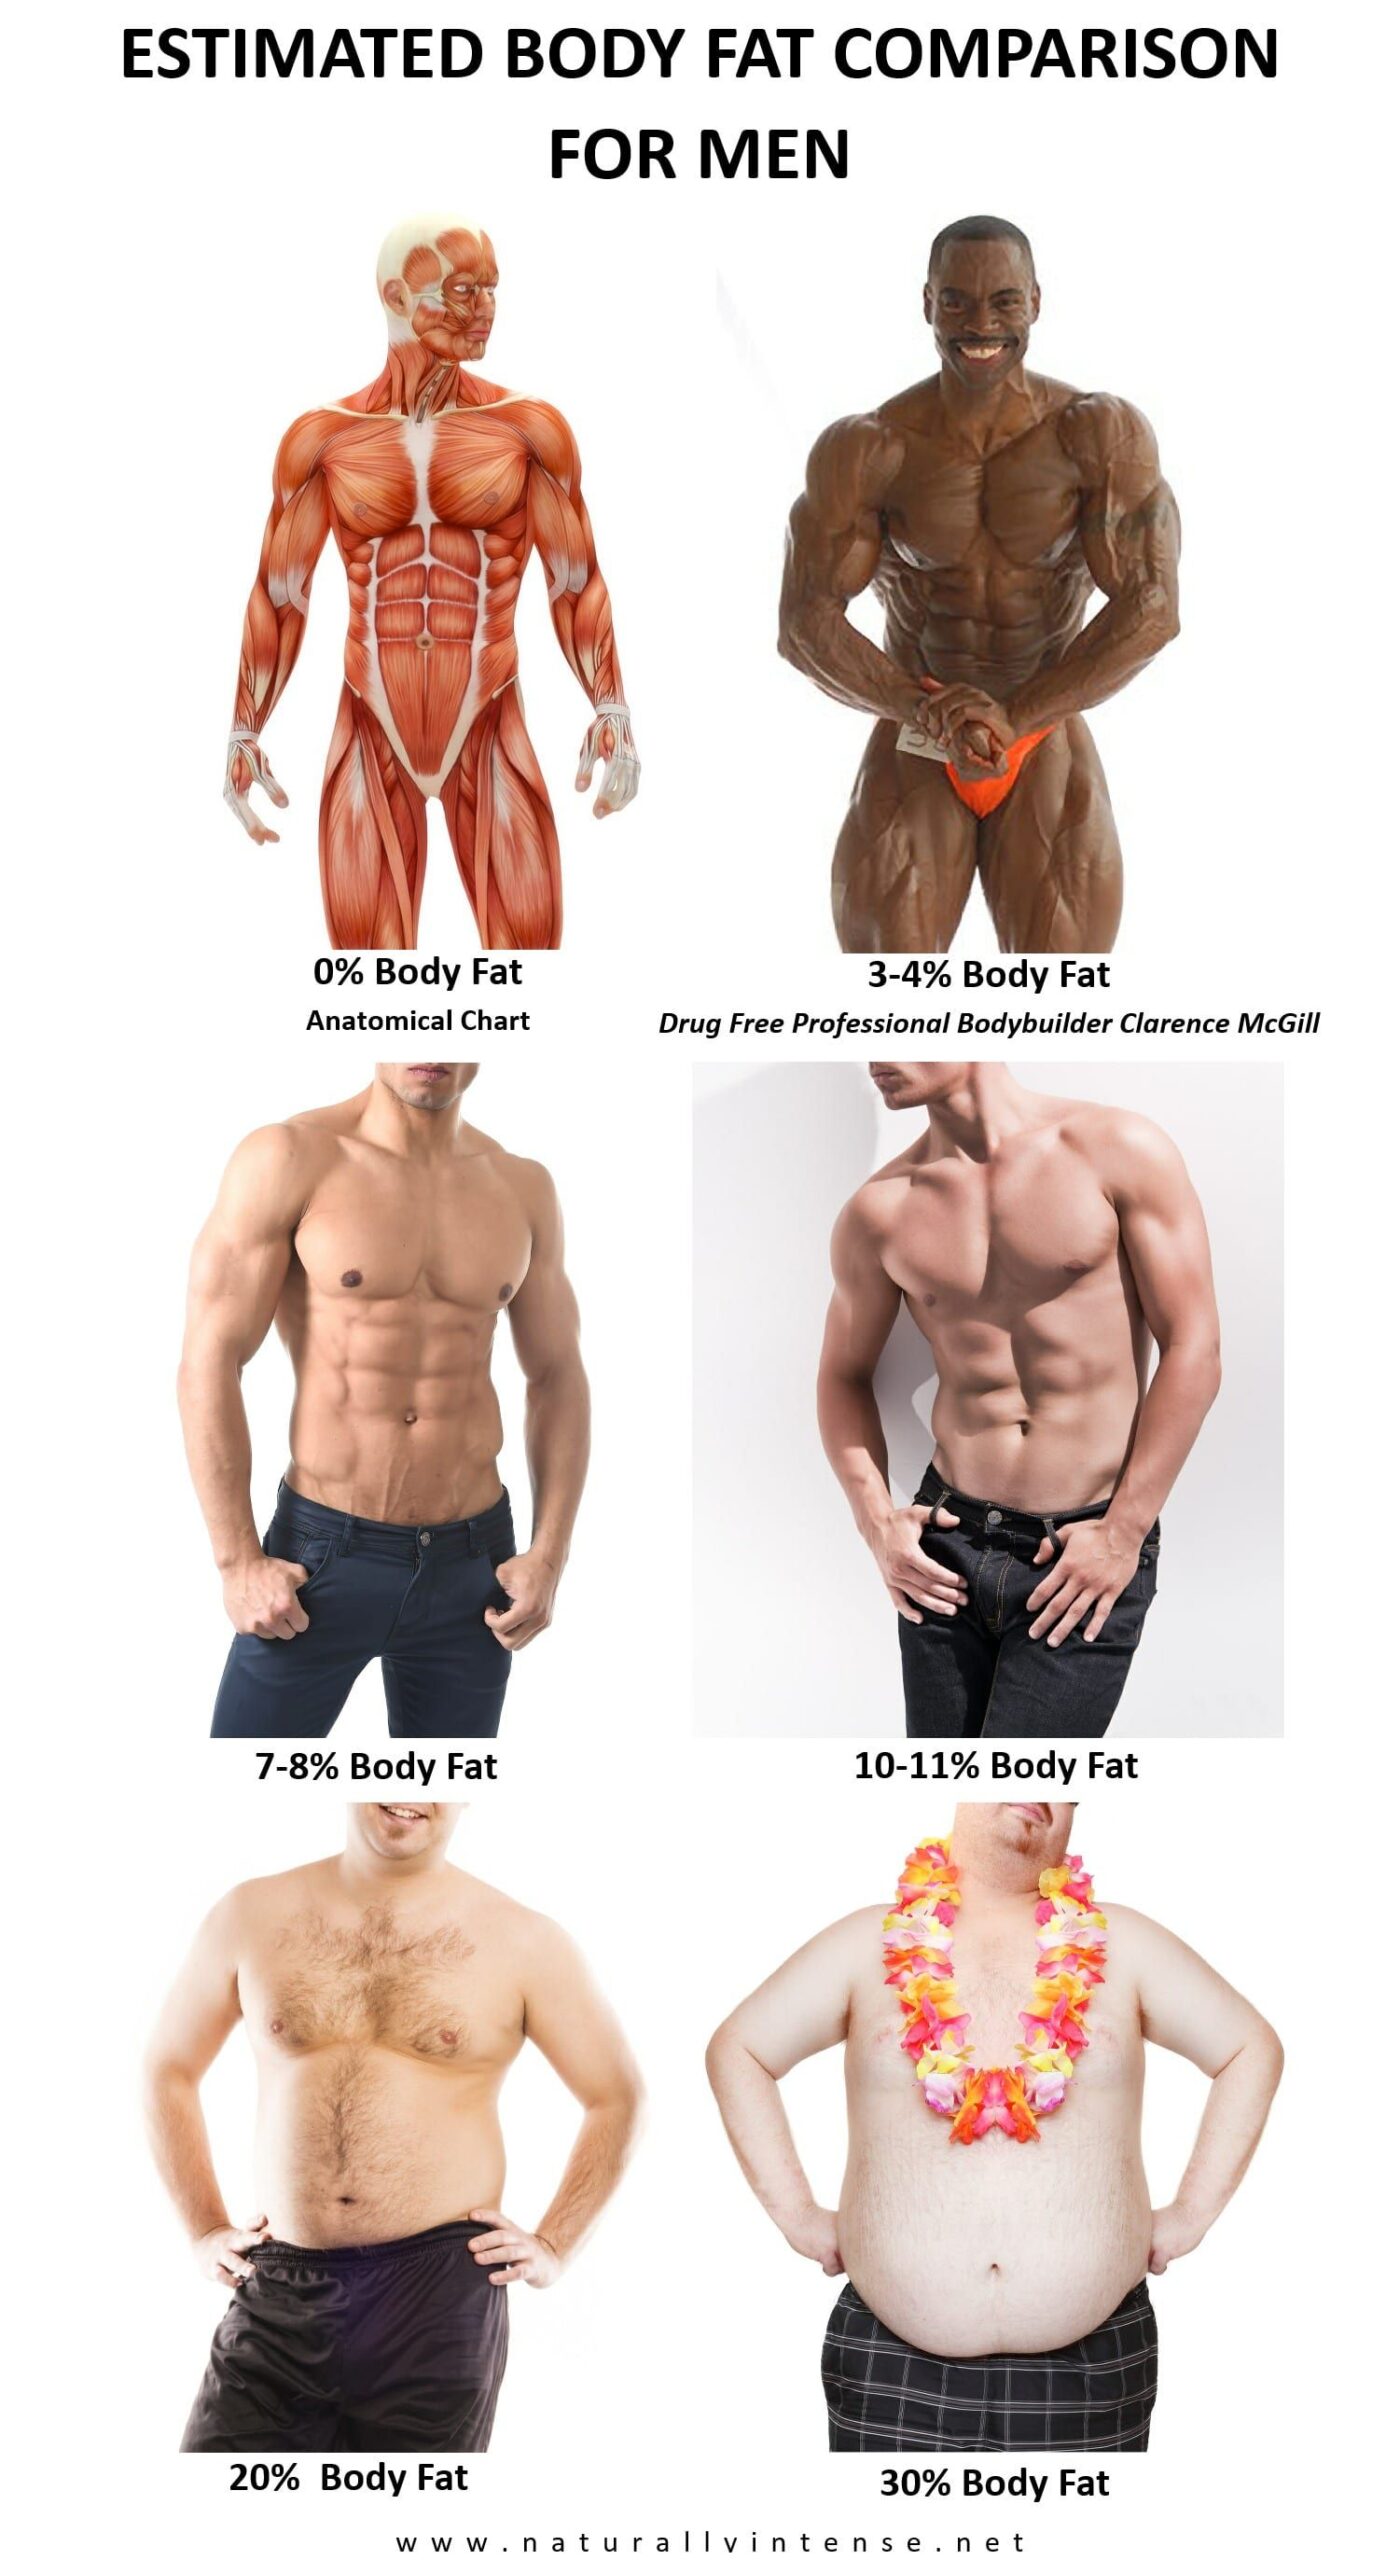
Body Fat Categories for Men
- Essential fat: 2 to 5%. Stage-ready bodybuilder territory. The body looks striated with visible muscle separation. Not maintainable long-term.
- Athletes: 6 to 13%. A six-pack is clearly visible. Veins appear on the forearms and shoulders. This is the range most people associate with being “ripped.”
- Fitness: 14 to 17%. A light four-pack may show when the abdominal muscles are flexed. Overall appearance is lean. This range is sustainable for most active men.
- Acceptable: 18 to 24%. No visible abdominal definition. A soft midsection is present, but the person doesn’t appear overweight. The average American man sits around 22 to 25%.
- Obese: 25% and above for men. Significant abdominal fat. Health risks including cardiovascular disease and insulin resistance increase meaningfully above this threshold.
How to Read a Body Fat Picture Chart Accurately
A body fat visual chart uses photographs taken under specific lighting, at specific poses, with subjects of similar heights and muscle mass. When you compare yourself to one of these charts, the comparison is only accurate if you match the posture and lighting conditions. Photos taken with overhead lighting or a flexed pose will always look leaner than relaxed, natural lighting shots. This is why people often overestimate their body fat when looking at reference charts: they compare a relaxed self-image to a posed, optimally lit reference photo.
Measuring Your Actual Body Fat Percentage
A body fat comparison is only as useful as your actual measurement. The most accessible methods:
- Skinfold calipers: Measure subcutaneous fat at 3 to 7 body sites. Accuracy is within 3 to 4% when performed by a trained technician. Consumer-grade calipers used at home introduce more error.
- Bioelectrical impedance (BIA): Home scales and handheld devices send a small current through the body. Accuracy is within 5 to 8% and varies significantly with hydration level. Measure first thing in the morning before eating or drinking for the most consistent readings.
- DEXA scan: The most accurate consumer-accessible method, within 1 to 2%. A scan takes about 10 minutes and costs $40 to $75 at imaging centers. Gives you a regional breakdown showing fat distribution by body segment.
- Navy tape method: Uses neck and waist measurements for men, and neck, waist, and hip measurements for women. Free, requires only a tape measure, and is accurate within 3 to 5% compared to DEXA for most body types.
Why Muscle Mass Changes the Visual
Two people at identical body fat percentages can look completely different based on their muscle mass. A woman at 22% body fat with significant muscle development from resistance training looks noticeably leaner than a woman at 22% with minimal muscle. The muscle occupies space that fat would otherwise fill, creating contour and definition even at the same fat percentage. This is why body fat percentage chart pictures showing lean-looking subjects may actually correspond to higher percentages than you expect if those subjects have high muscle mass.
Setting Realistic Goals
Losing 1% body fat per month is realistic for most people in a moderate caloric deficit with regular resistance training. Starting at 30% and targeting 22% means an eight-month minimum timeline under ideal conditions. Using monthly progress photos under the same lighting and pose, alongside regular measurements, gives you a more honest body fat comparison than any single method alone.
Bottom line: A body fat percentage visual is a useful guide, not a precise measurement. Use it to understand the rough territory you’re in, not to diagnose yourself to the decimal. Pair the visual reference with an actual measurement method, set a realistic timeline, and track progress consistently.