Body Fat Pictures: A Visual Guide to Every Percentage Range
Body Fat Pictures: A Visual Guide to Every Percentage Range
You’ve read the numbers but they don’t tell you much without a visual reference. Body fat pictures give you a concrete anchor for understanding what different percentages actually look like on real bodies. The challenge is that body fat percentage images vary significantly based on muscle mass, height, bone structure, and where a person naturally stores fat. Two people at 20% body fat can look notably different from each other, which is why a single photo isn’t the whole story.
Body fat examples from fitness charts often use models with high muscle mass, making the percentages look leaner than average people at those numbers. Visual body fat references are most useful when you use several images across a range rather than fixating on one. Learning to visually estimate body fat percentage takes practice, but it’s a skill that helps you set realistic goals and track progress beyond what the scale shows.
Women’s Body Fat Percentage Visual Guide
10 to 13% (Essential fat): This is the lower limit for female physiology. Women at this level typically have highly defined muscle striations, visible vascularity in the arms, and very little soft tissue. This range is associated with hormonal disruption and is not a sustainable health goal for most women.
14 to 20% (Athletic): Clear muscle definition in arms, shoulders, and the appearance of a flat or lightly defined abdomen. The body looks lean but not extreme. Female athletes in running, swimming, and gymnastics often fall in this range during their competitive season.
21 to 24% (Fitness): A lean, healthy appearance. The abdomen may be flat or slightly soft. Arms and legs show some definition. This is often described as the “toned” look in fitness media.
25 to 31% (Average/Acceptable): Softness around the abdomen, hips, and thighs is visible. The average American woman falls in this range. No significant muscle definition, but the body doesn’t appear unhealthy.
32% and above (Obese): Significant fat stores around the abdomen, back, and limbs. Health risk for metabolic disease increases substantially above 35%.
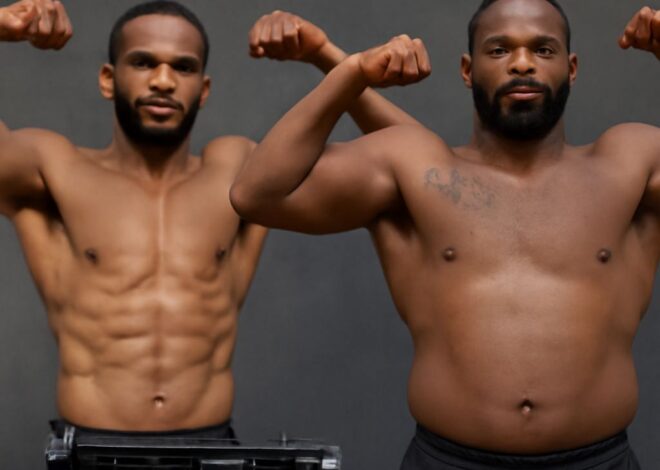
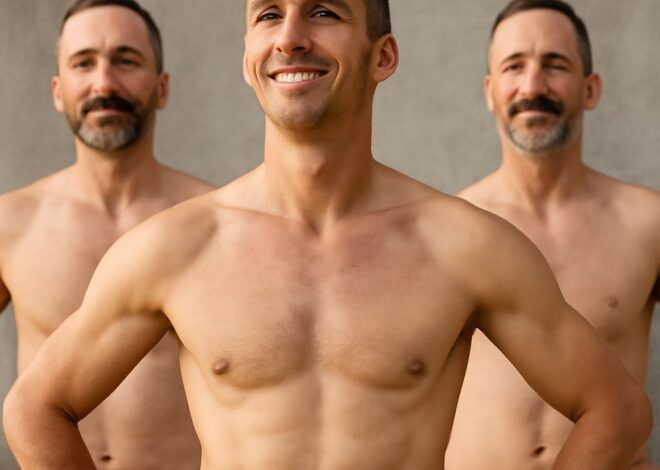
Men’s Body Fat Percentage Visual Guide
2 to 5% (Essential fat): The look of a stage-ready bodybuilder. Extreme vascularity, visible muscle separation, and very thin skin over the muscles. Unsustainable long-term and not a goal for general health.
6 to 13% (Athletic): A visible six-pack at 6 to 9%. Muscle separations visible in arms, shoulders, and chest. Veins visible in forearms. This is what most men mean when they say they want to “get lean.”
14 to 17% (Fitness): A slight four-pack may show when the abs are flexed. Overall appearance is lean and athletic without extreme definition. Many recreational athletes and consistent gym-goers land here.
18 to 24% (Average/Acceptable): A soft midsection is present with no visible abdominal definition. The body doesn’t look overweight, but there’s clear fat covering the muscle. The average American man sits around 22 to 25%.
25% and above (Obese): Significant abdominal fat, often extending to a noticeable belly. Cardiovascular and metabolic disease risk increases meaningfully above this threshold.
Why Body Fat Examples Look Different on Different People
Two people at the same body fat percentage look different because of muscle mass. A woman at 22% body fat who lifts weights three times per week has more muscle than a woman at 22% who doesn’t exercise. The muscle creates shape and contour that makes the same fat percentage look leaner. This is the key limitation of any visual body fat chart: it can’t account for individual variation in muscle development.
Frame size matters too. A broad-shouldered person at 20% body fat looks different than a small-framed person at the same percentage. The fat distributes across more surface area on a larger frame, which can make it appear less prominent.
How to Use Visual Body Fat References Accurately
When comparing yourself to body fat percentage images, use these practices:
- Compare in similar lighting. Overhead or harsh lighting makes muscles look more defined. Natural, diffused lighting is closest to a neutral reference.
- Compare relaxed versus relaxed. Posing and flexing in reference photos makes subjects look leaner than they would at rest.
- Use multiple reference images rather than a single photo. One image shows one person’s distribution; several images show the range at a given percentage.
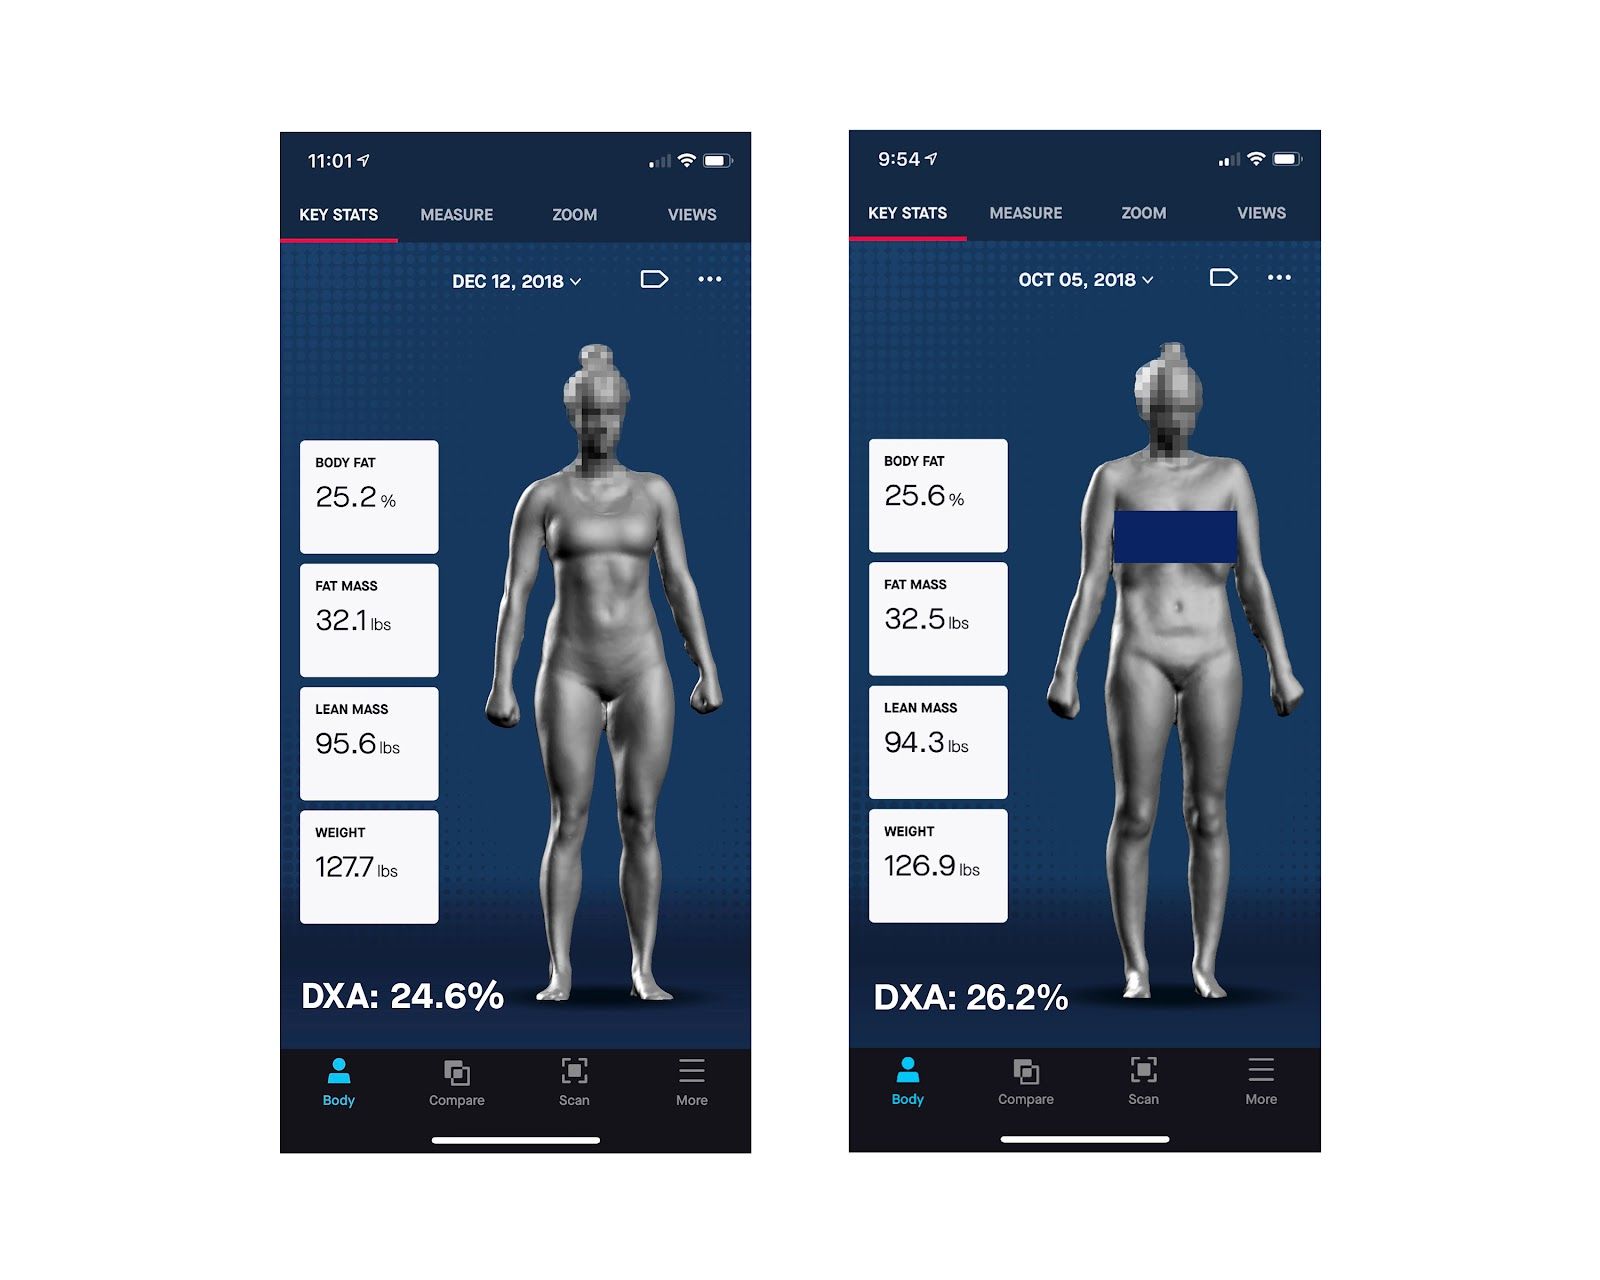
- Combine visual estimation with a measurement method like calipers or bioelectrical impedance for the most accurate picture of where you actually are.
Setting Goals Based on Visual Body Fat
Choose a goal range rather than a specific number. Targeting “15 to 18%” is more realistic than targeting “exactly 15%” because your natural fat distribution and muscle mass will determine what your body looks like at any given percentage. Losing 1% body fat per month is a realistic rate for most people in a moderate caloric deficit with consistent resistance training. At that pace, moving from 28% to 20% takes roughly eight months of consistent effort.
Bottom line: Body fat pictures are a useful starting reference, not a precise standard. Use the visual guide above to understand what range you’re likely in, confirm it with a measurement method, and set goals in ranges rather than single numbers for the most realistic planning.